If your sub-account offers Calendar Appointment Services or Rentals, you now have access to a dedicated set of reporting widgets built specifically for these business types. These widgets give you deep visibility into booking performance, revenue generation, staff efficiency, coupon usage, and inventory status — all directly from your dashboard or custom reports. This article walks you through what’s available, how to add these widgets in your dashboard. * * * ## What’s Included All widgets listed are also available in quick filters and the custom metrics ### Appointment Service Widgets (11 widgets) These widgets provide critical insights into your service-based revenue and performance:
# | Widget | What It Shows |
1 | Total Revenue | Total revenue generated from all service bookings |
2 | Revenue by Service | Revenue breakdown by individual service offered |
3 | Revenue by Category | Revenue breakdown by service category |
4 | Average Order Value | Average revenue per service booking |
5 | Top Grossing Staff | Staff members generating the highest revenue |
6 | Top Performing Locations | Service locations generating the highest revenue |
7 | Cancelled Revenue | Revenue lost from cancelled service bookings |
8 | Coupon Redemptions | Total number of coupon codes redeemed across all bookings |
9 | Revenue from Coupons | Total revenue from bookings where a coupon was applied |
10 | Top Coupon Codes | Most frequently used coupon codes |
11 | Bookings with Coupon | Total bookings where a coupon was applied |
### Rentals Widgets (11 widgets) These widgets help you manage inventory, track rental revenue, and monitor booking status:
# | Widget | What It Shows |
1 | Total Rentals Booked | Total number of rental bookings |
2 | Booking Status Breakdown | Distribution of bookings by status (confirmed, pending, cancelled) |
3 | Total Revenue (Excluding Deposits) | Rental revenue excluding security deposits |
4 | Security Deposit Collected | Total security deposits collected from booked rentals |
5 | Average Order Value | Average revenue per rental booking |
6 | Revenue by Listing | Revenue breakdown by individual rental listing |
7 | Most Booked Listings | Most frequently booked rental listings |
8 | Upcoming Rentals | Bookings scheduled for the upcoming week |
9 | Overdue Rentals | Rentals past their end date that are not completed |
10 | Unconfirmed Rentals | Bookings pending confirmation |
11 | Active Rentals | Rentals currently in progress |
Note: Appointment count now reflects meetings only — Previously, dashboard’s appointment count widgets in the Meetings module included both meeting and service bookings. They now show meeting appointments only. Service and rental booking counts have their own dedicated widgets under the Services sub-module. * * * ## Where to Find These Widgets The Appointment Service widgets live under the Appointments sub-module in the widget library. The two previously standalone widgets — Appointment Count by Service and Appointment Count by Service Category — have also been moved into this sub-module to keep all service-related widgets in one place.
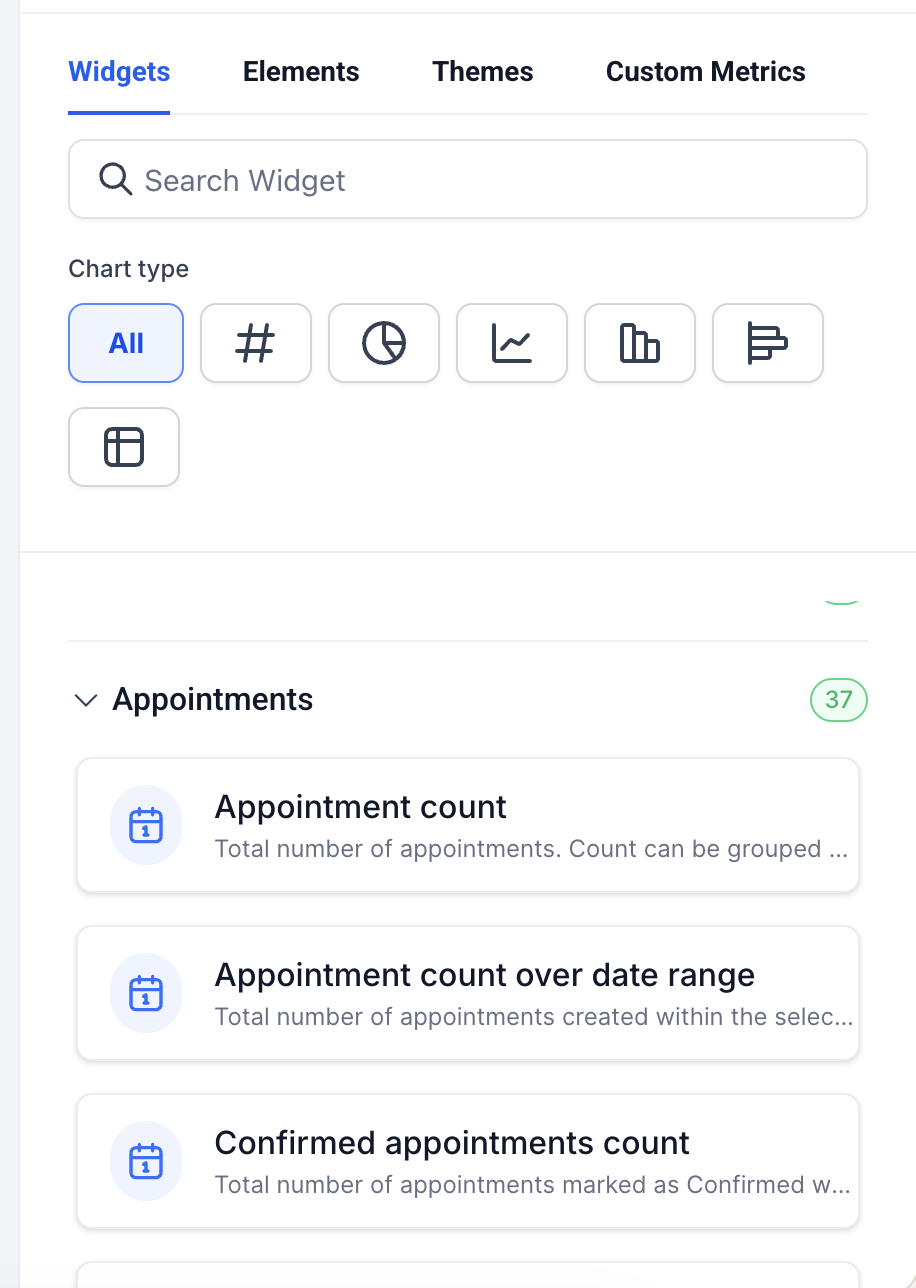
Here is the reference for more information. * * * ## How to Add Services or Rentals Widgets to Your Dashboard ### Step 1: Navigate to Your Dashboard Log into your account and select the Dashboard tab from the left-hand menu. ### Step 2: Enter Edit Mode Click the “Edit dashboard” at the top-right corner of the dashboard to enter edit mode. If you’d like to add these widgets to a new dashboard instead, click Add Dashboard → Select a Blank Dashboard and give it a name before continuing. ### Step 3: Open the Widget Menu Click Add Widget. This opens the widget panel on the right-hand side of the screen. ### Step 4: Navigate to Appointments In the widget panel, browse to the relevant sub-module i.e Appointments:!(
https://assets.patientcopilot.ai/17a80059356d2c70.png) You can also use the search bar at the top of the widget panel to find a specific widget by name. ### Step 5: Select Your Chart Type Before adding the widget, choose how you want the data visualized. Available chart types include: 1. Numeric 2. Donut Chart 3. Line Chart 4. Bar Chart 5. Horizontal Bar Chart 6. Table Chart Select the chart type that best fits the metric. For example, Total Revenue works well as a Numeric widget, while Revenue by Service is clearer as a Bar Chart or Donut Chart. ### Step 6: Configure the Widget In the widget settings panel: 1. Title and Description — Optionally add a custom name and short description so your team knows what the widget tracks. 2. Chart Type — Adjust the chart type if needed directly from the Configure tab. 3. Live Preview — Review how the widget will look before saving. ### Step 7: Apply Filters (Optional) Switch to the Conditions tab to filter the widget data: 1. Click Add Filter to create your first filter group. 2. Use +AND to add more filters within the same group. 3. Click +Add Filter again to create a new group (this creates an OR condition between groups). ### Step 8: Save the Widget Once configured, click Save to add the widget to your dashboard. ### Step 9: Organize Your Widgets After adding your widgets, drag and drop them into position and resize them as needed to create a clean, readable layout. ### Step 10: Save Dashboard Changes Click Save Changes at the top of the dashboard to lock in your layout. * * * ## How Calendar Settings Control Your Widgets Sub-account Calendar Settings toggles directly govern the availability of Services and Rentals widgets, quick filters, and custom metrics in your reporting. - If a service type or rental feature is disabled in Calendar Settings, its associated widgets, quick filters, and custom metrics will be hidden in the dashboard and custom reports builder. - If it is enabled, all related widgets and filters will be available to add and configure. To check or update these settings: 1. In Agency view, Sub-accounts goto your respective sub account. 2. Select Calendar Settings. 3. Toggle the relevant service or rental features on or off based on what your sub-account offers. This ensures your reporting configuration always stays aligned with your active Calendar capabilities. * * * ## Adding These Widgets to Custom Reports Services and Rentals widgets are also available in the Custom Reports builder, not just the dashboard. 1. Navigate to Reporting → Custom Reports. 2. Open an existing report or create a new one. 3. Click Add Widget and browse to the Appointments sub-module. 4. Follow the same configuration steps outlined above. * * * ## Tips - Use Upcoming Rentals and Overdue Rentals side by side to get a quick snapshot of your rental inventory health. - Pair Top Grossing Staff with Top Performing Locations to understand whether revenue concentration is people-driven or location-driven. - Track Coupon Redemptions alongside Revenue from Coupons to measure the actual ROI of your promotions. If a widget isn’t appearing in your widget library, check your Calendar Settings to confirm the relevant feature is enabled for your sub-account.