
How to view Google Ad Campaign Statistics in Ad Manager
This guide explains how to view detailed statistics for your Google Ad Campaigns using the Ad Manager statistics tab in Patient Copilot. You can review performance at a campaign, ad group, ad, and keyword level, enabling better optimisation and ROI analysis.
Step 1 | Access the Statistics tab
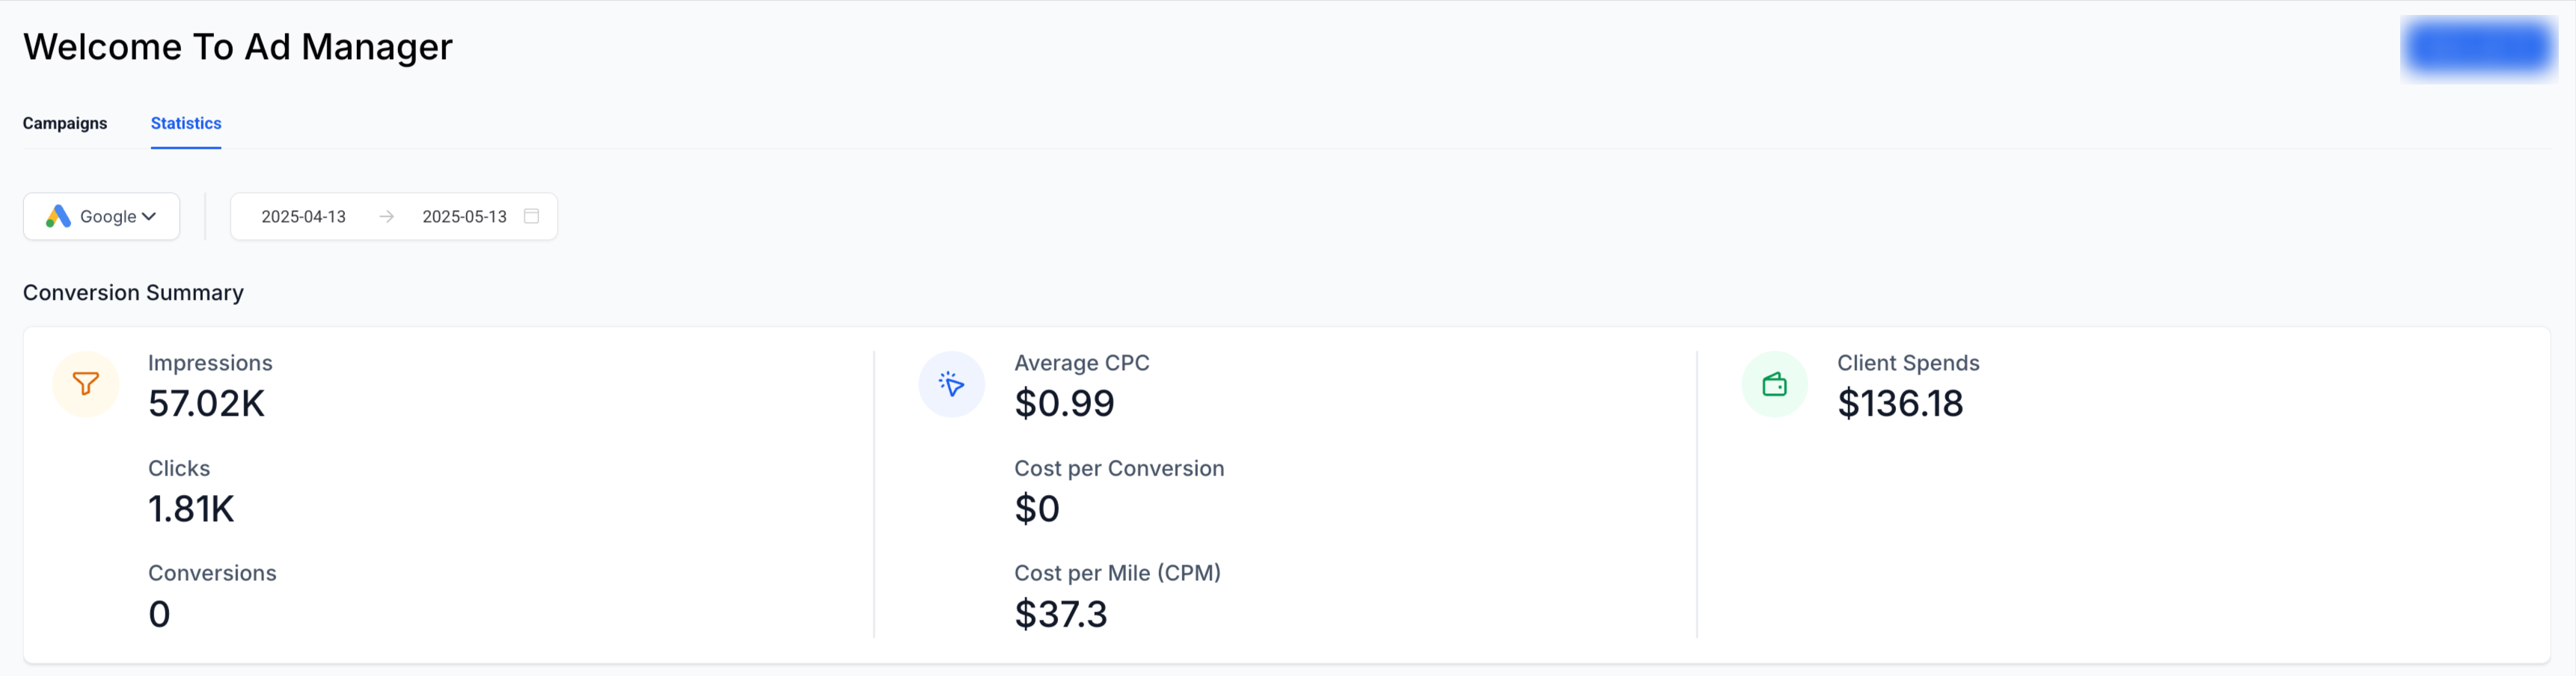
- Navigate to Ad Manager. 2. Click on the Statistics tab at the top of the screen. 3. Select Google from the platform dropdown. 4. Choose a date range to filter the results.
Step 2 | Understand the conversion summary panel
The top section of the Statistics view includes a high-level Conversion Summary with the following metrics:
- Impressions: Total times your ads were displayed.
- Clicks: Number of user clicks.
- Conversions: Completed actions attributed to the campaign.
- Average CPC: Average cost-per-click.
- Cost per Conversion: Calculated cost to acquire one conversion.
- CPM: Cost per thousand impressions.
- Client Spends: Total ad spend by the account.

Step 3 | Performance Analytics
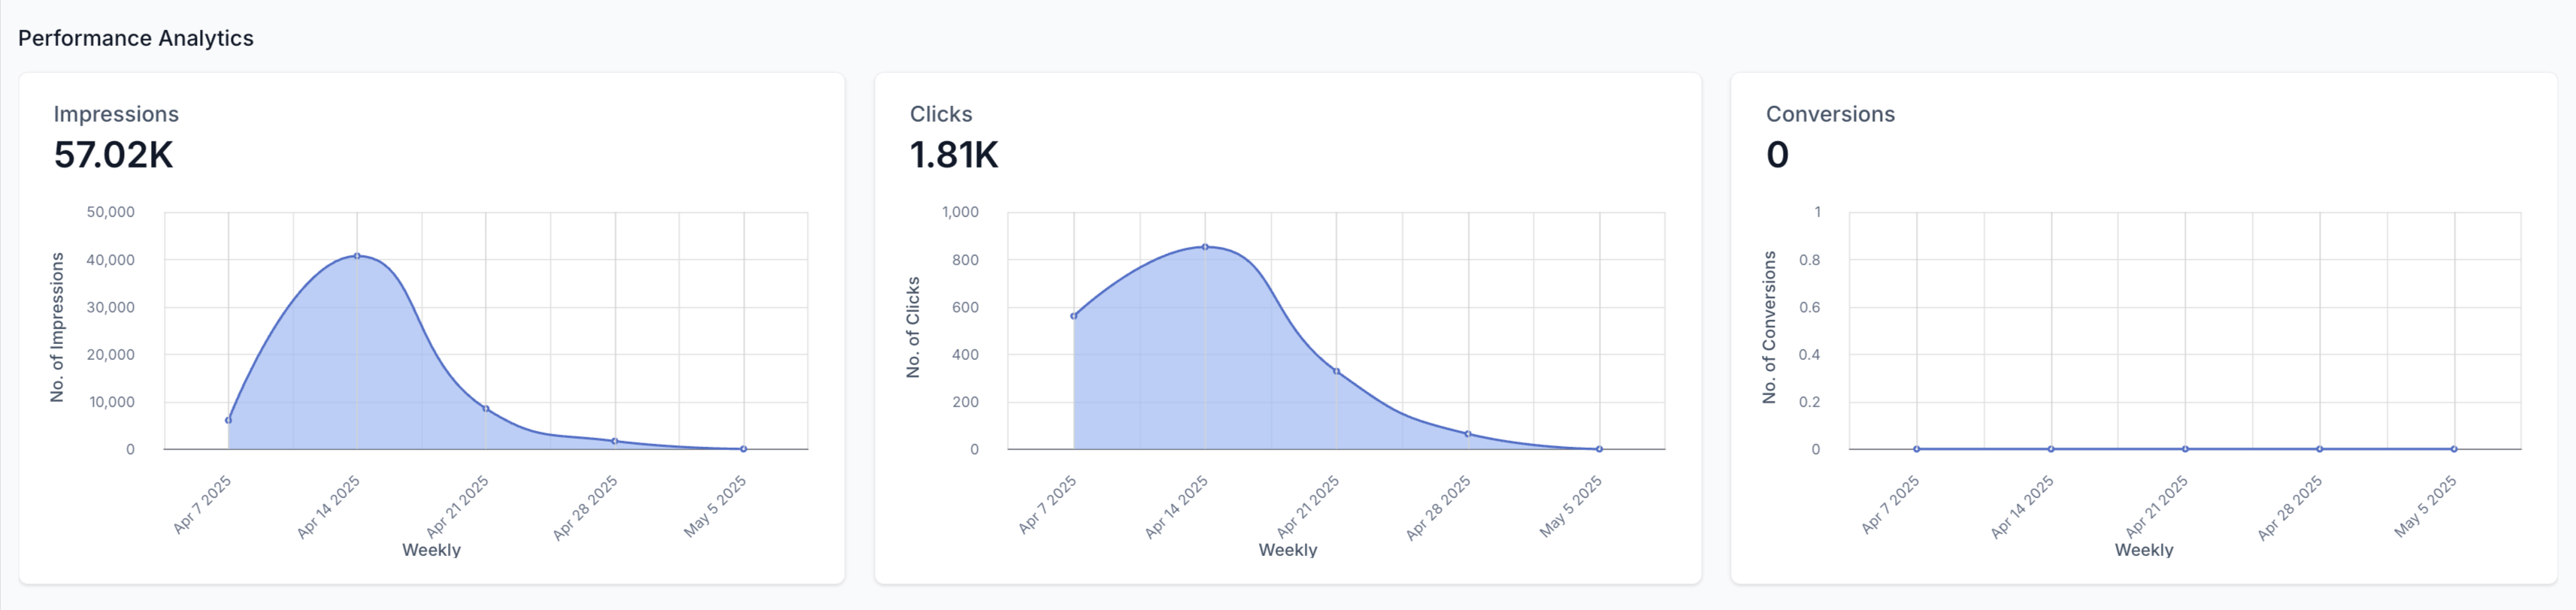
Just below the summary, you will find Performance Analytics in a visual graph format:
- Impressions graph shows how visibility trends over time.
- Clicks graph reveals engagement volume.
- Conversions graph helps track conversion trends. You can use these visuals to understand campaign behaviour and spot anomalies or opportunities.
Step 4 | Dive Into Campaign-level metrics
Scroll to the Campaign Details table to analyse all your campaigns:
- Clicks, CTR, CPC, Impressions
- Sales, Revenue, ROI%, Leads
- Cost per Lead (CPL), Cost per Sale (CPS) Use the search bar to look up a specific campaign and export or customise columns as needed.

Step 5 | View detailed Statistics for an Individual Campaign
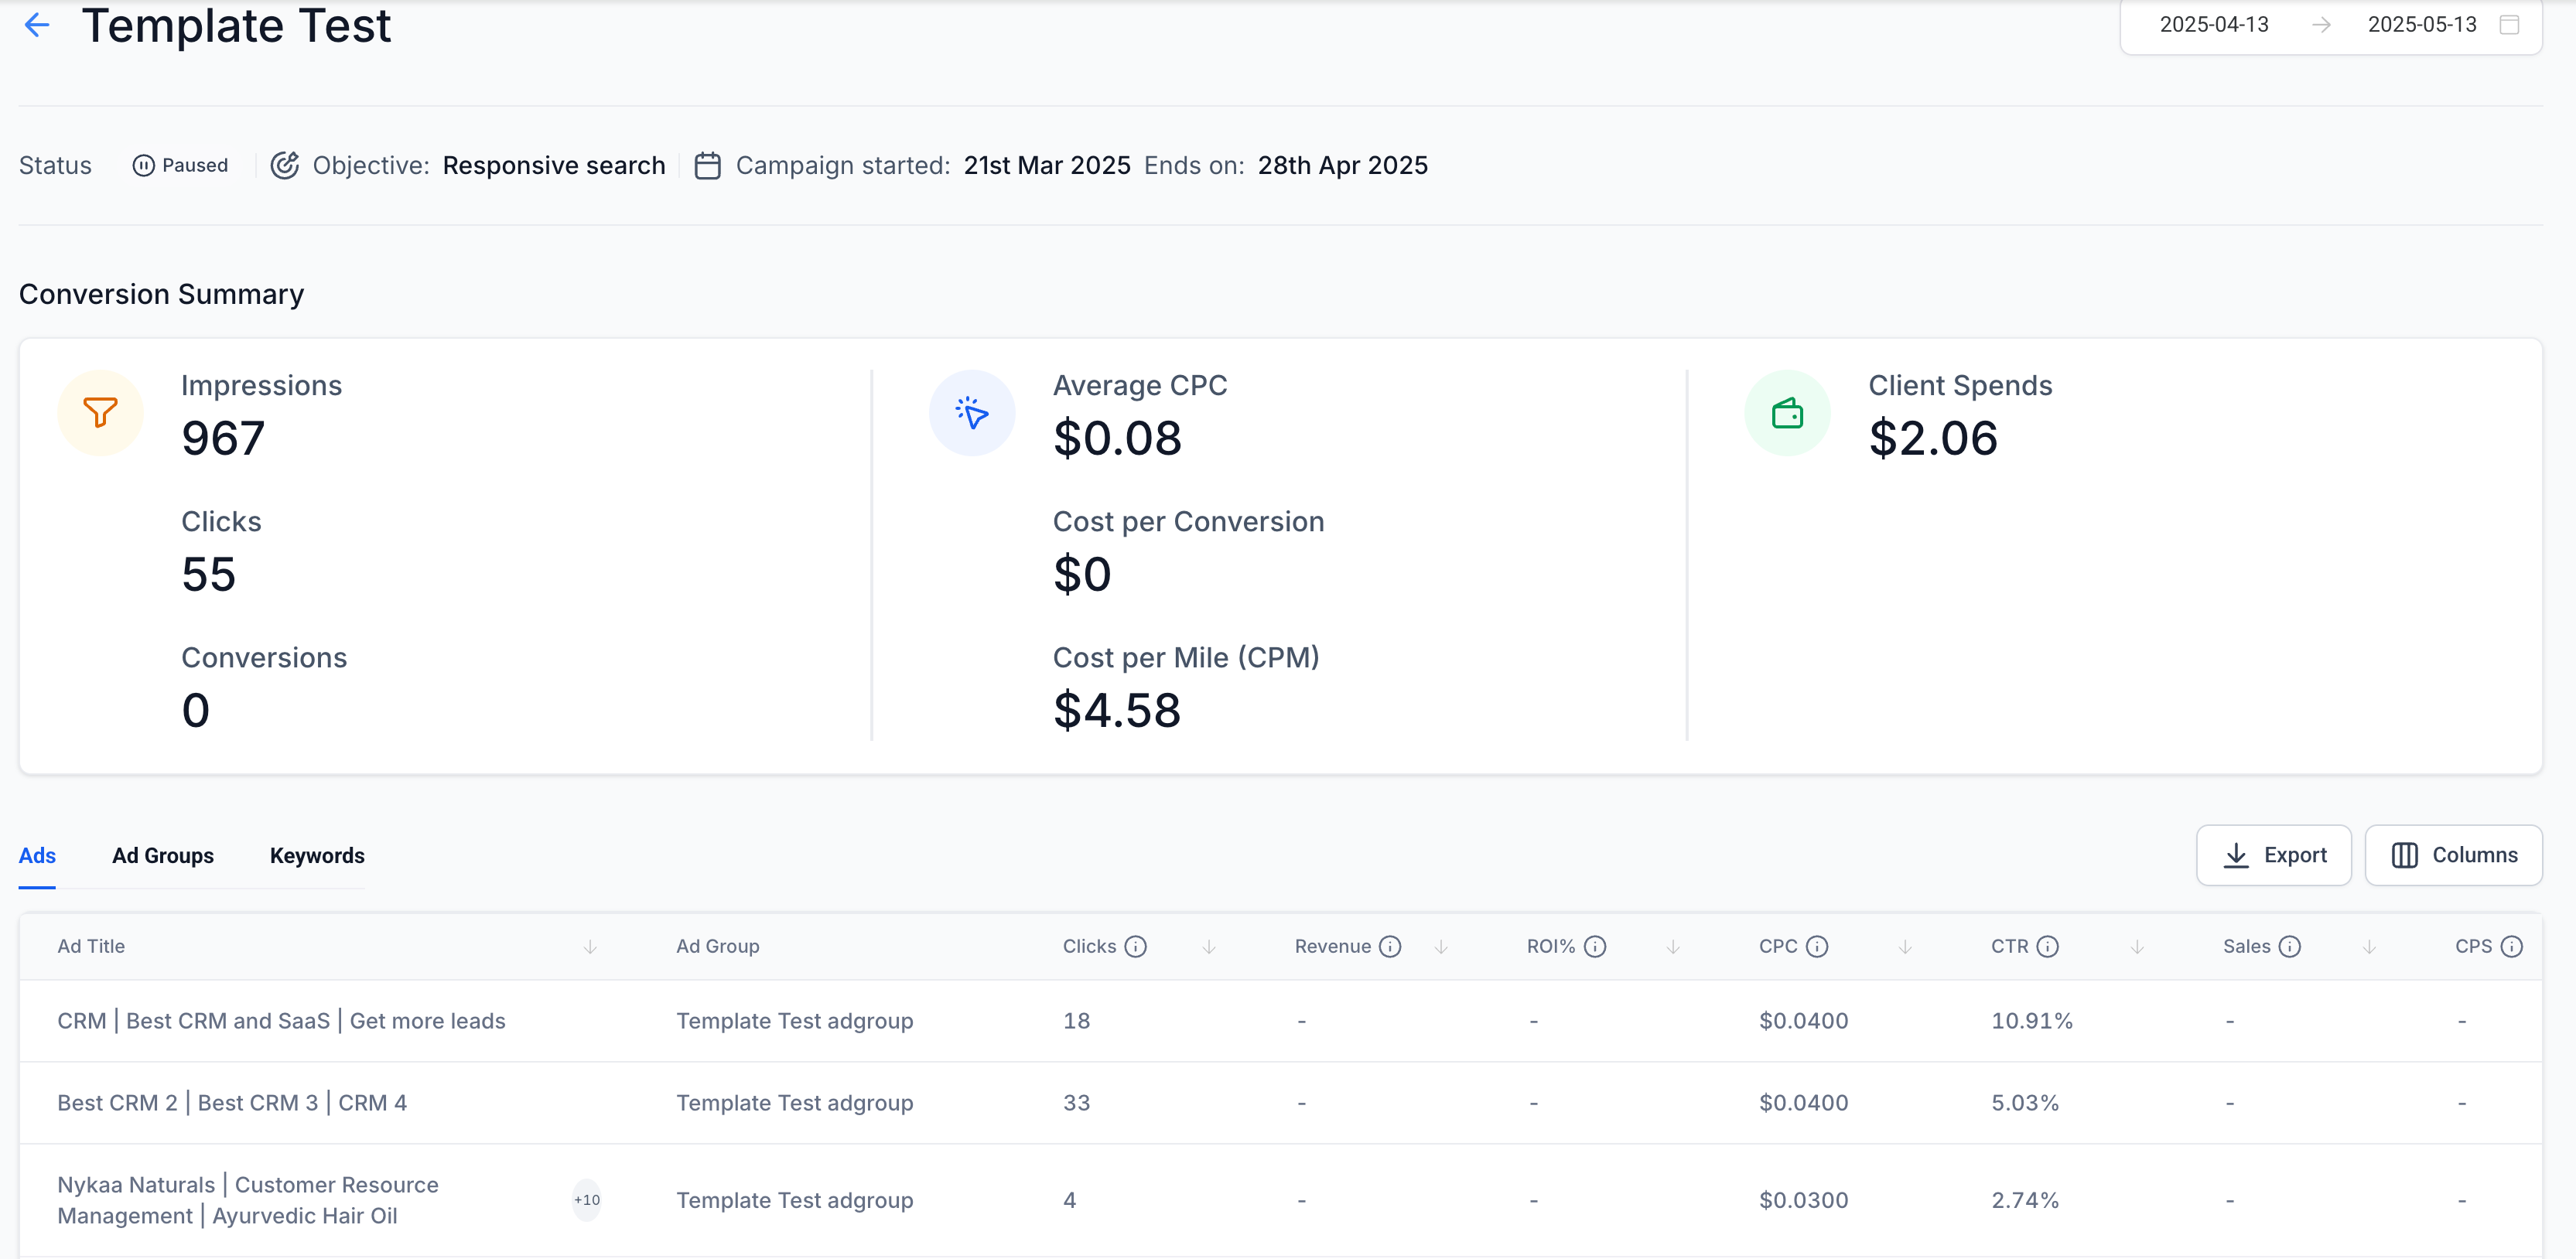
- From the campaign list, click on a campaign name. 2. This opens the campaign dashboard with deeper insights at three sub-levels:
- Ad Group Performance: View metrics like clicks, impressions, conversions for each group.
- Ad Performance: Understand how each creative performs within ad groups.
- Keyword Performance: Discover which keywords are driving results or underperforming.
This granularity helps you:
- Pause low-performing ad groups or keywords.
- Adjust budgets to high-performing segments.
- Optimize creatives that show strong engagement.
Notes: - Data refreshes periodically. Allow some time after publishing before metrics populate.
- Zero conversions may indicate issues with tracking setup or landing page performance.
- Use consistent date ranges for accurate comparisons.
Was this article helpful? That’s Great! Thank you for your feedback Sorry! We couldn’t be helpful Thank you for your feedback Feedback sent We appreciate your effort and will try to fix the article