How to Test and Debug AI Conversations in Agent Studio
Agent Studio’s Message Execution Timeline and Chat Emulator provide full visibility into every step of an AI conversation so you can debug faster, identify slowdowns, and deploy agents with confidence. * * * ## What is the Message Execution Timeline & Chat Emulator? The Message Execution Timeline and Chat Emulator are built-in tools in Agent Studio that help you test and debug AI conversations with full visibility. The Timeline records every event, tool call, and decision your agent makes along with model metrics, while the Chat Emulator lets you simulate conversations, reset sessions, and jump directly to the node responsible for any response. Together, they provide a clear view of agent behavior so you can identify issues, validate logic, and improve performance with confidence. These tools remove the “black box” effect often associated with AI workflows by showing exactly what happens at each step of execution, allowing you to trace the logic, inspect inputs and outputs, and make targeted improvements based on real data. * * * ## Key Benefits of Testing and Debugging AI Conversations Testing and debugging your AI conversations in Agent Studio gives you complete visibility into how your agent thinks, responds, and performs. By combining real-time execution logs with a production-like testing environment, you can validate logic, identify bottlenecks, and refine performance before going live. - Complete execution transparency: Follow every node transition and tool invocation in the exact order they occur, eliminating guesswork. - Step-level performance insights: Detect slow prompts, API calls, or tool steps instantly and optimize them for faster responses. - Model and cost awareness: Review model details, token usage, temperature, and other execution settings directly alongside each message. - Instant issue resolution: Jump from any log entry straight to the responsible node on the canvas to make targeted fixes quickly. - Realistic testing environment: Validate conversations in a chat interface that mirrors the end-user experience, ensuring accurate QA. * * * ## Message Execution Timeline The Timeline appears beside the Chat Emulator and updates live as your agent runs. - Event cards list the node name, model, input/output tokens, and execution time
- Colored latency badges (red = slow; green = fast) highlight bottlenecks
- Hover to view raw JSON inputs/outputs for detailed inspection Task tracking with Todo Manager: Agent Studio now tracks multi-step agent work using a Todo Manager. Tasks display with descriptive labels and dynamic statuses so you can follow progress more reliably during a test run. - Tasks use label-based transitions instead of numeric indices.
- Status updates show which task is active and which tasks are completed.
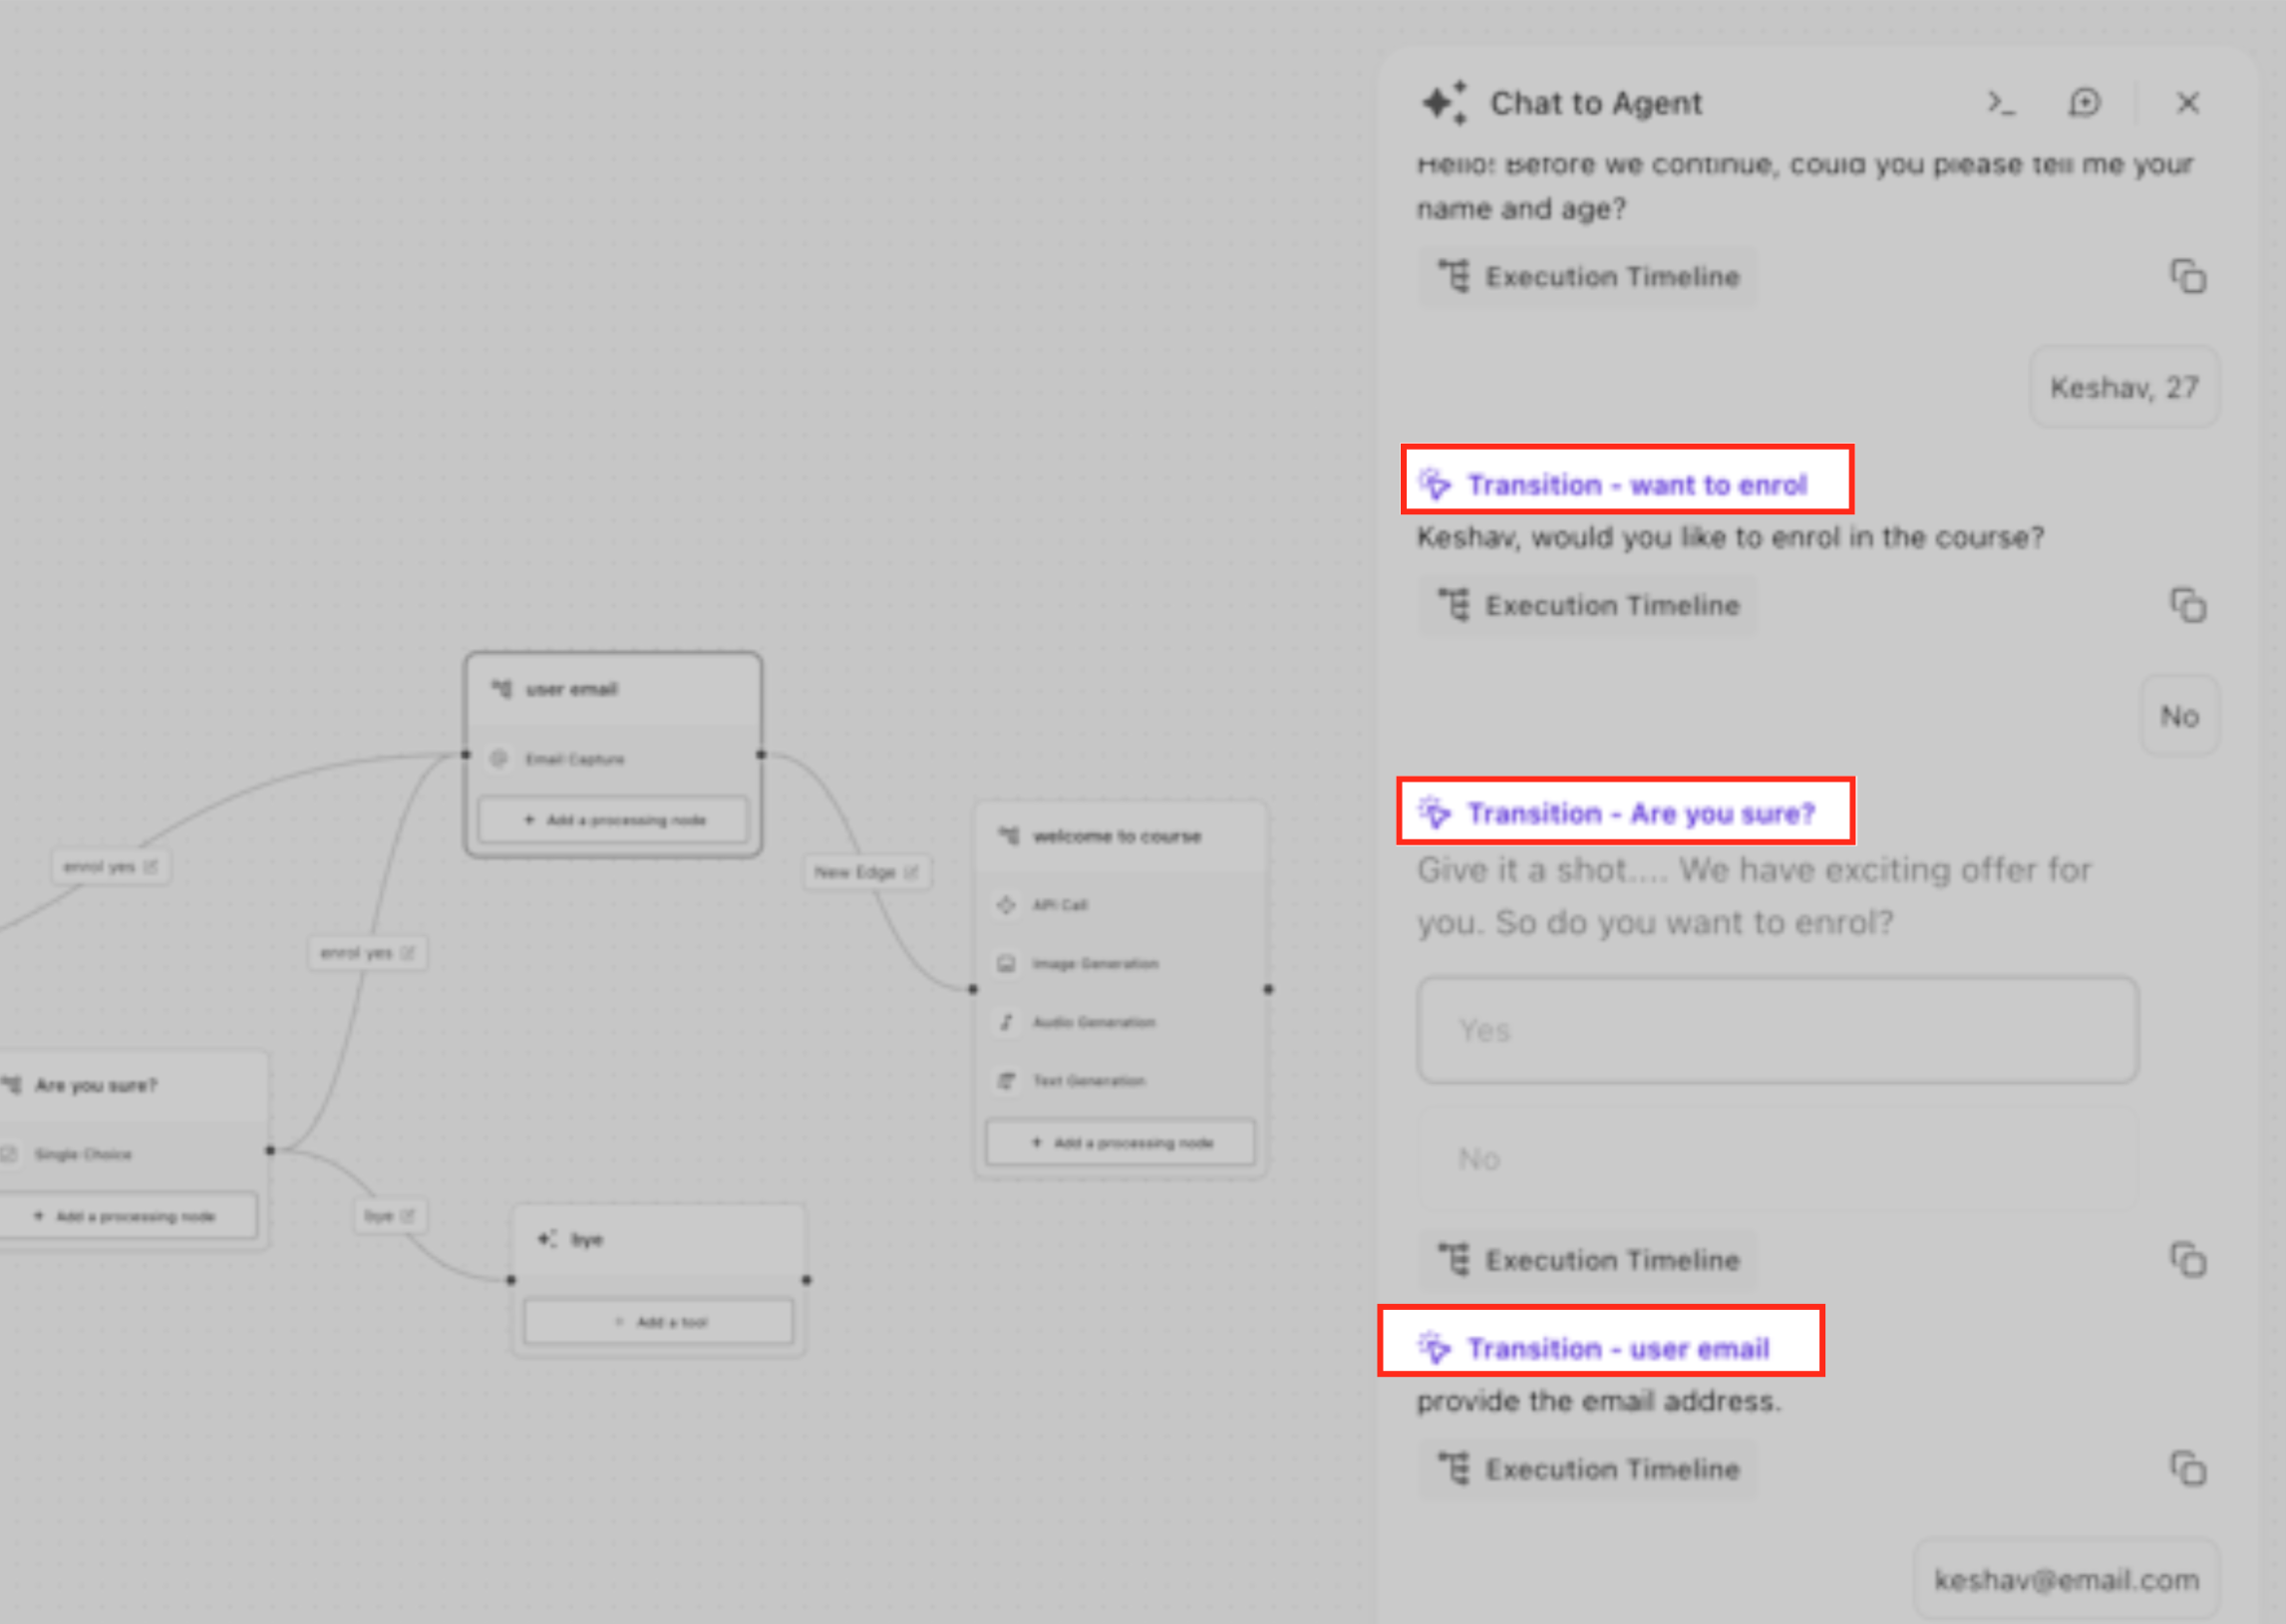
- This makes multi-step plans easier to review in the Timeline and reduces ambiguity when steps change order or new tasks are added. In addition to node transitions, multi-step task progress is tracked using labeled tasks. This helps you confirm which task the agent is working on as it moves through a longer sequence. * * * ## Transition Node Button In the Execution Timeline, each step displays a purple label. These clickable Transition labels indicate the exact node the conversation moved to during execution. Clicking the label automatically focuses and highlights that node on the canvas, allowing you to review or modify its logic immediately without manually searching through your flow. This makes debugging faster by directly connecting execution logs to the visual builder. * * * ## Performance Metrics Panel Beneath each message, the metrics footer displays: - Model & version (e.g., gpt-4-turbo)
- Input / output token counts
- Temperature, max tokens, top-p, frequency / presence penalties
- Total cost estimate (if billing is enabled) This information helps evaluate both performance and efficiency during testing. * * * ## Chat Emulator A Chat Emulator is a simulated chat interface used to test AI conversations safely. It provides a streamlined testing environment that mirrors real-world deployment scenarios. - Clean, mobile-responsive chat window with avatar support
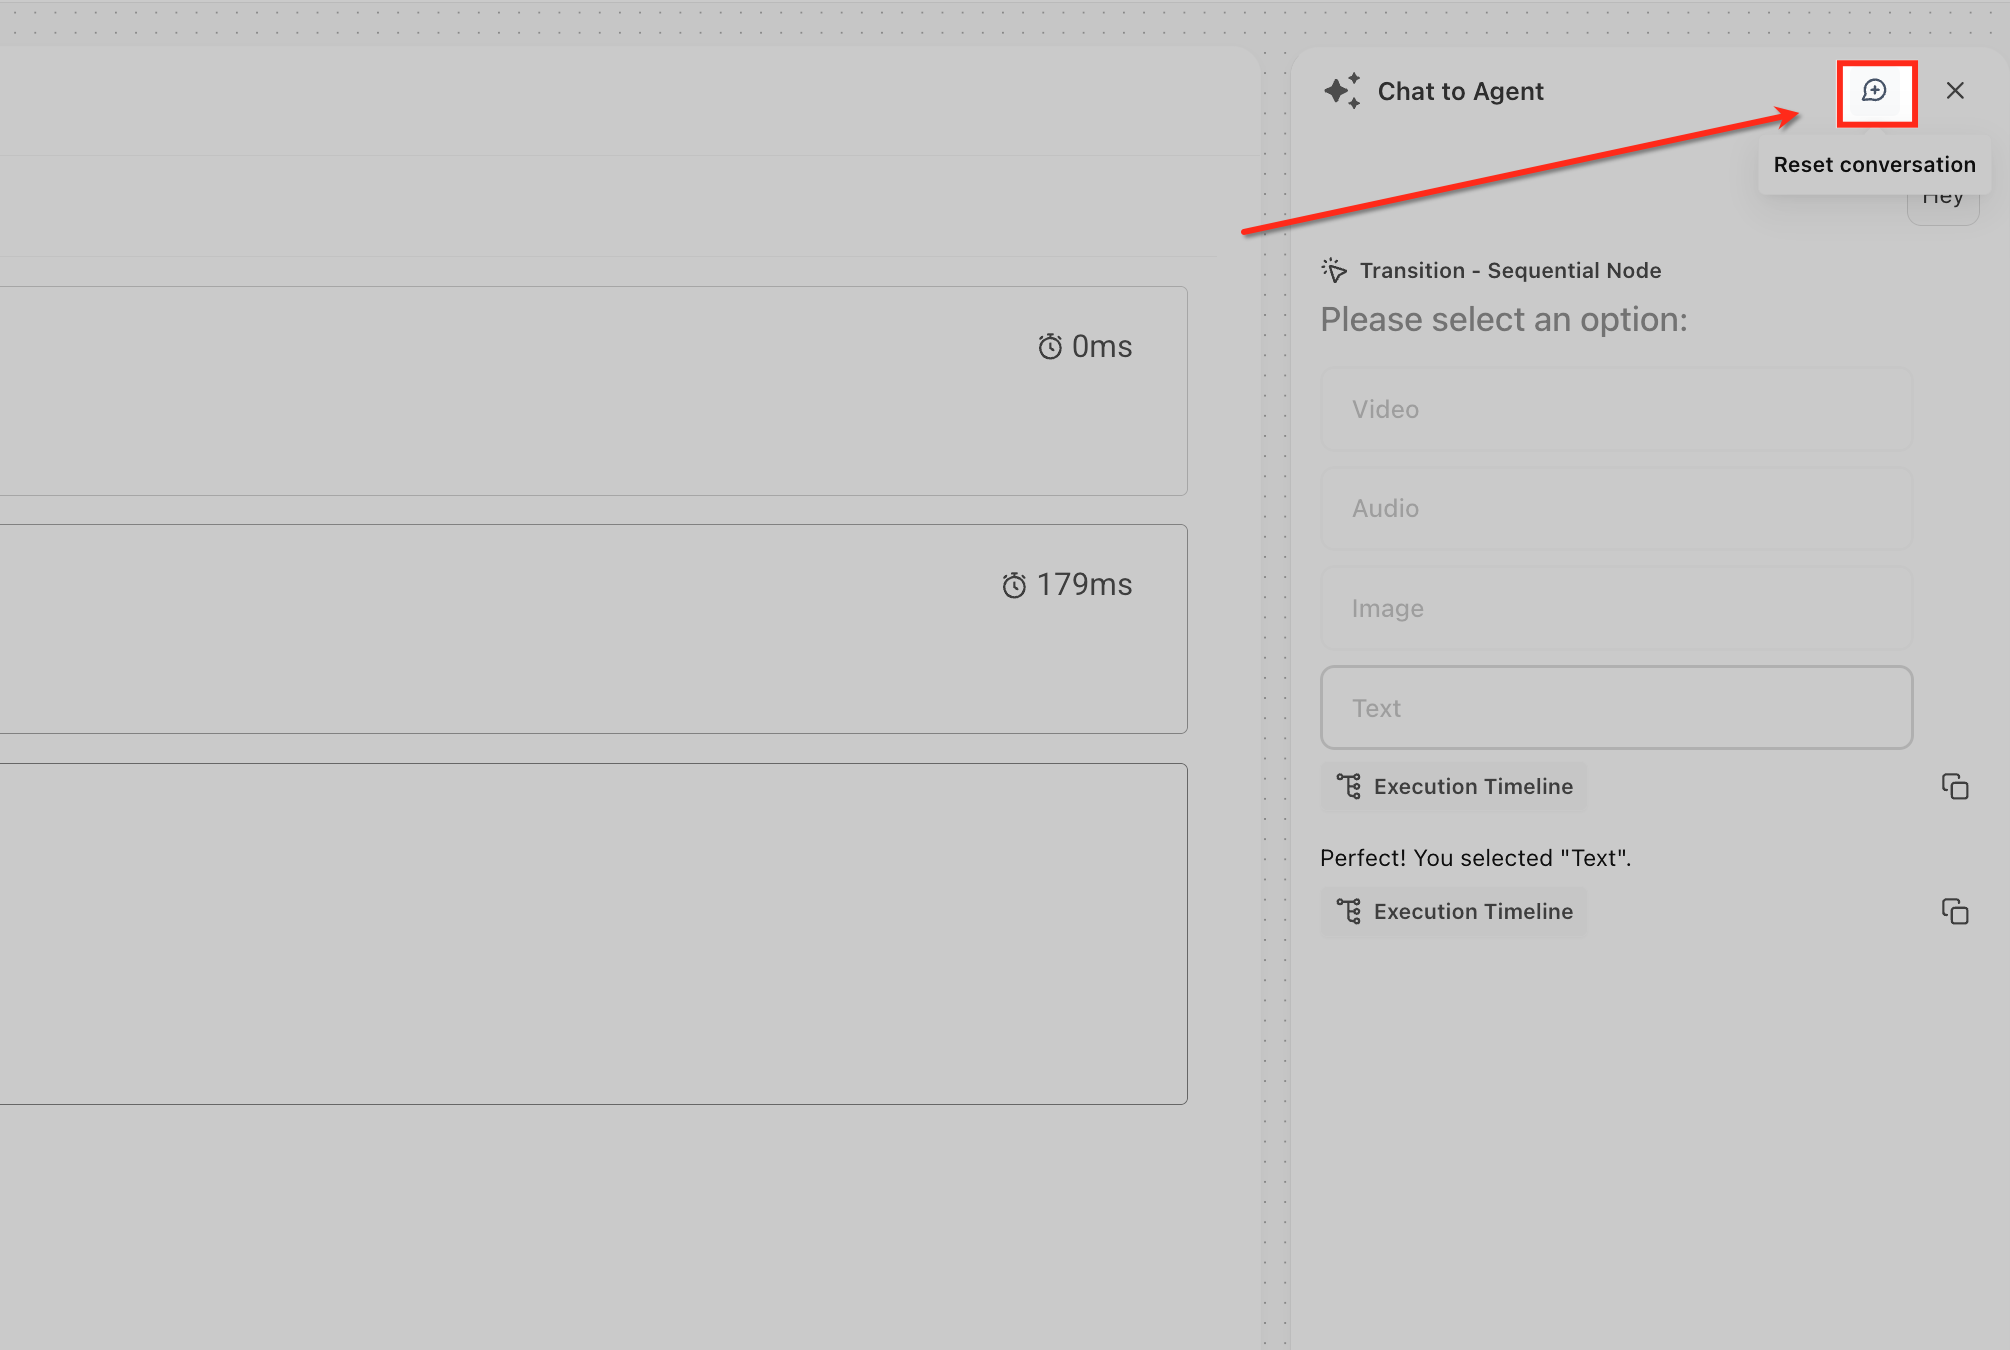
- Reset button to clear context between runs
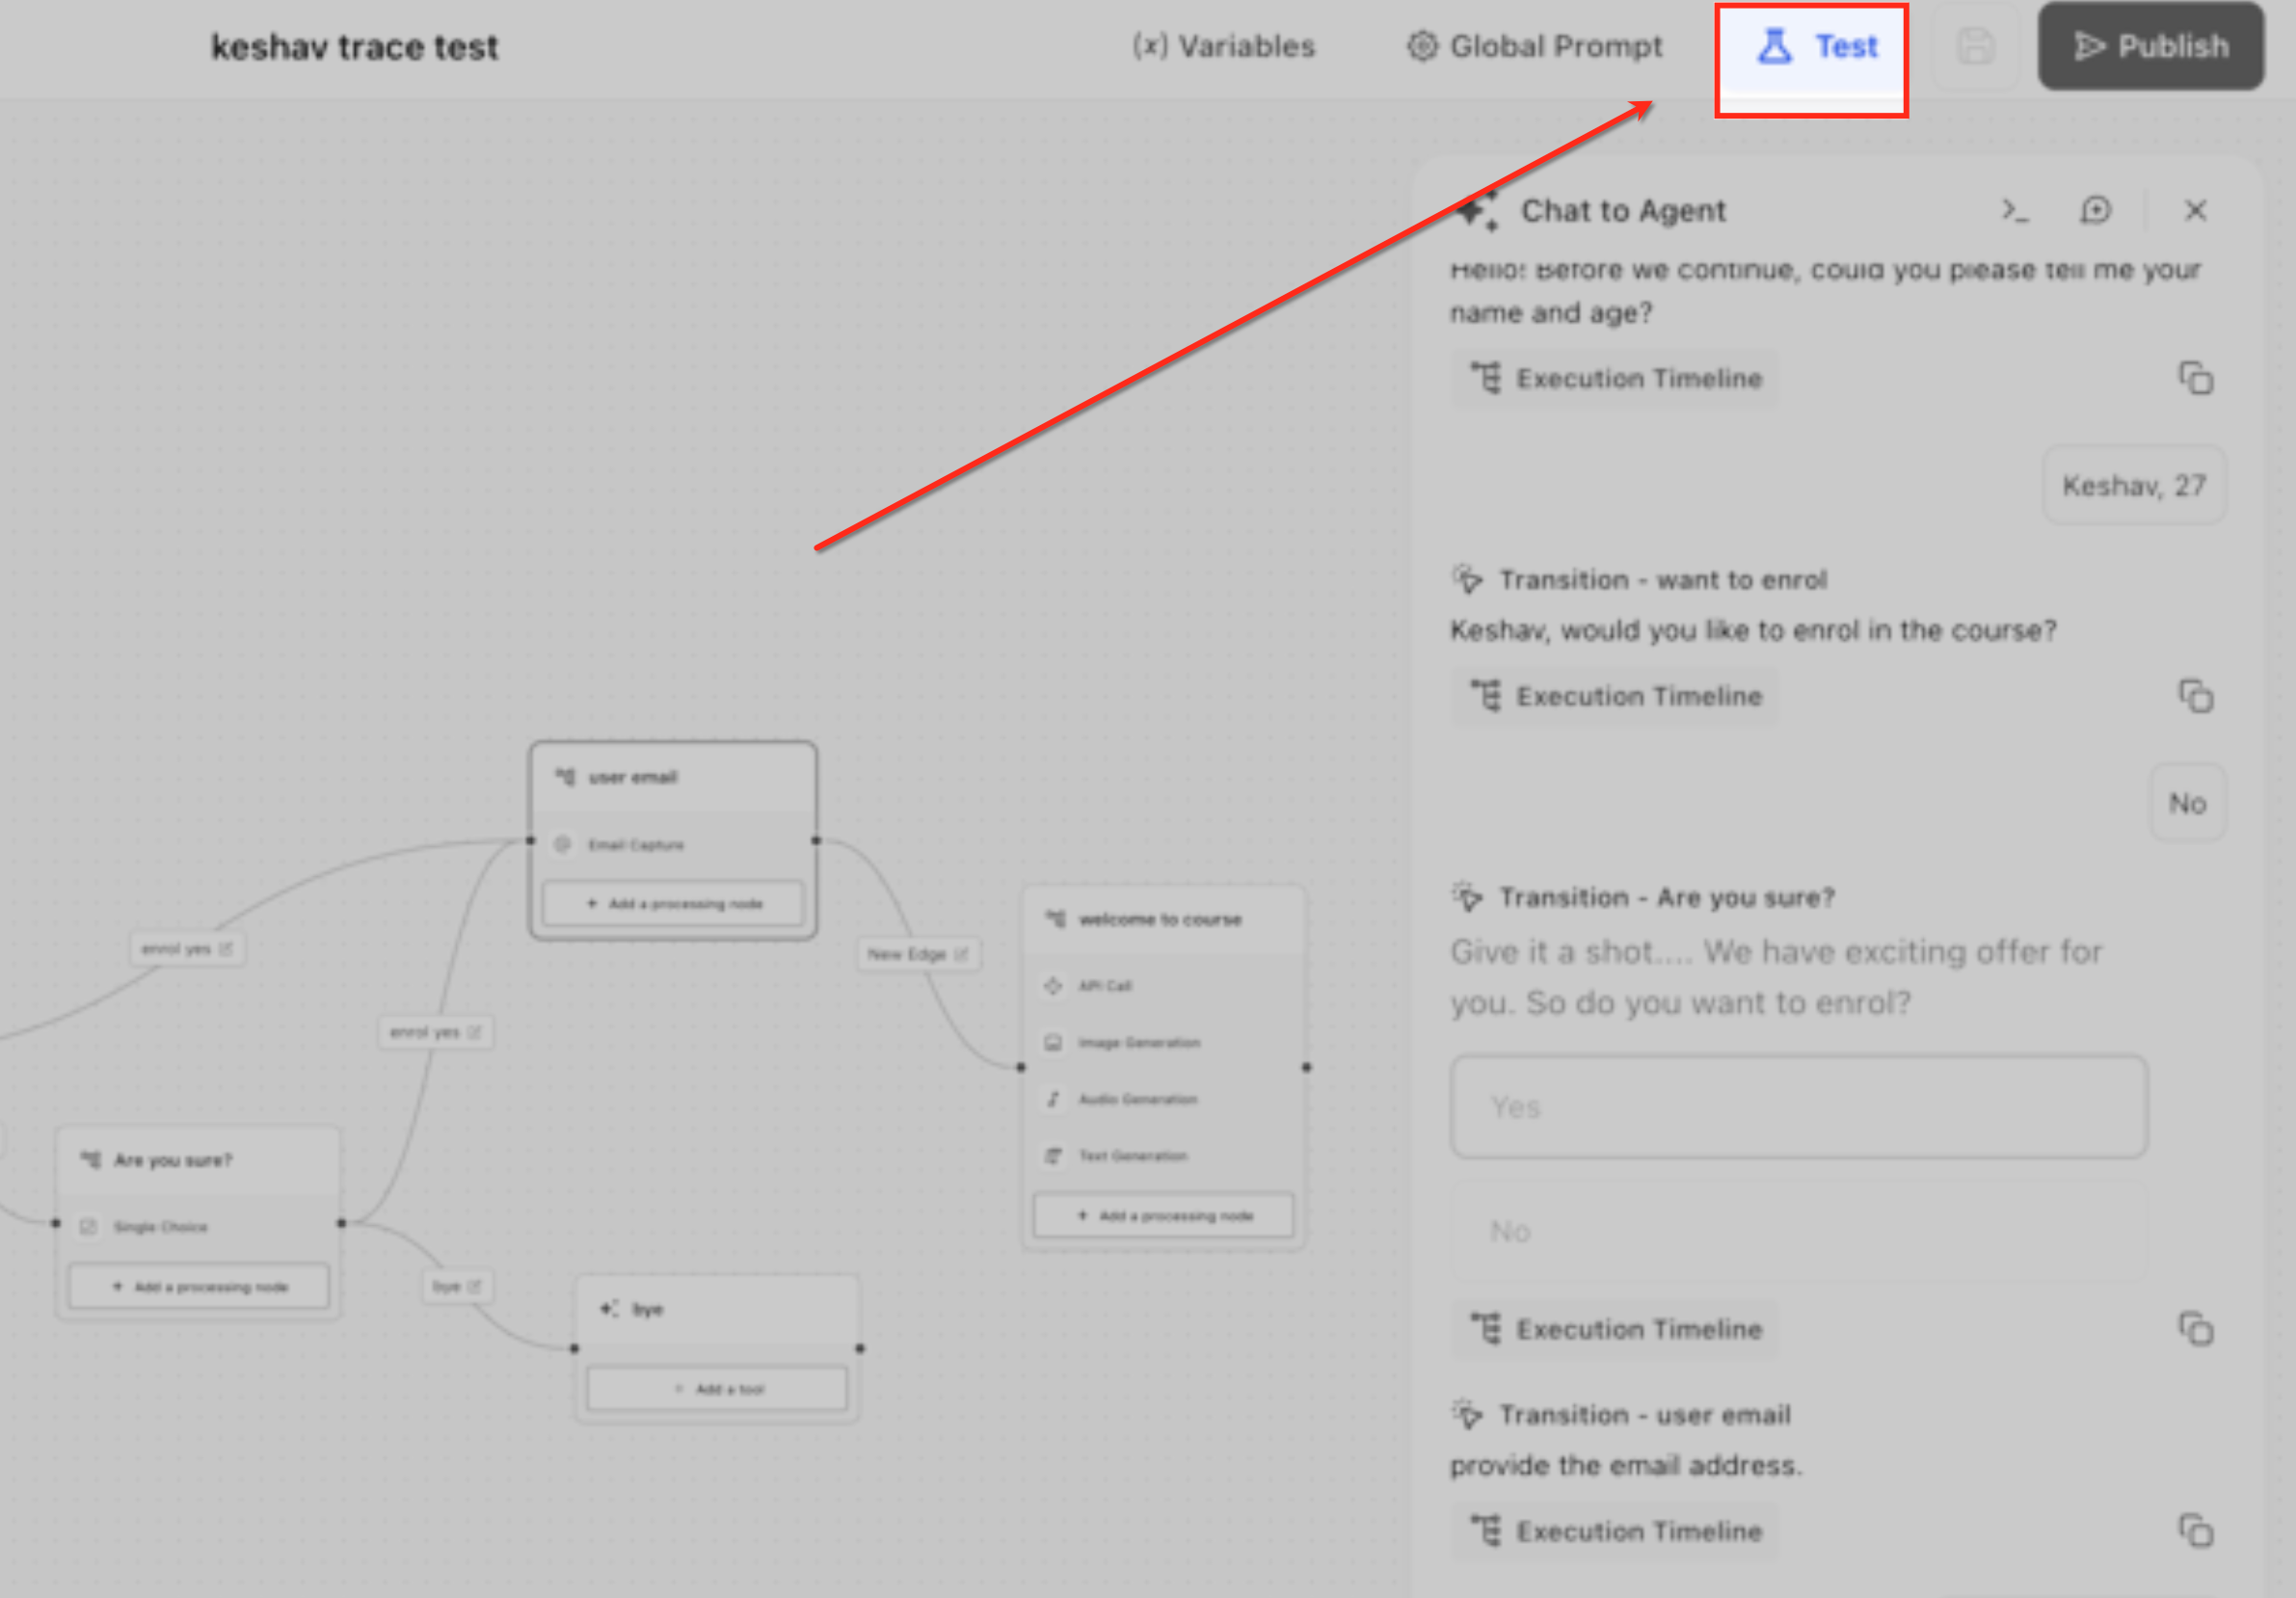
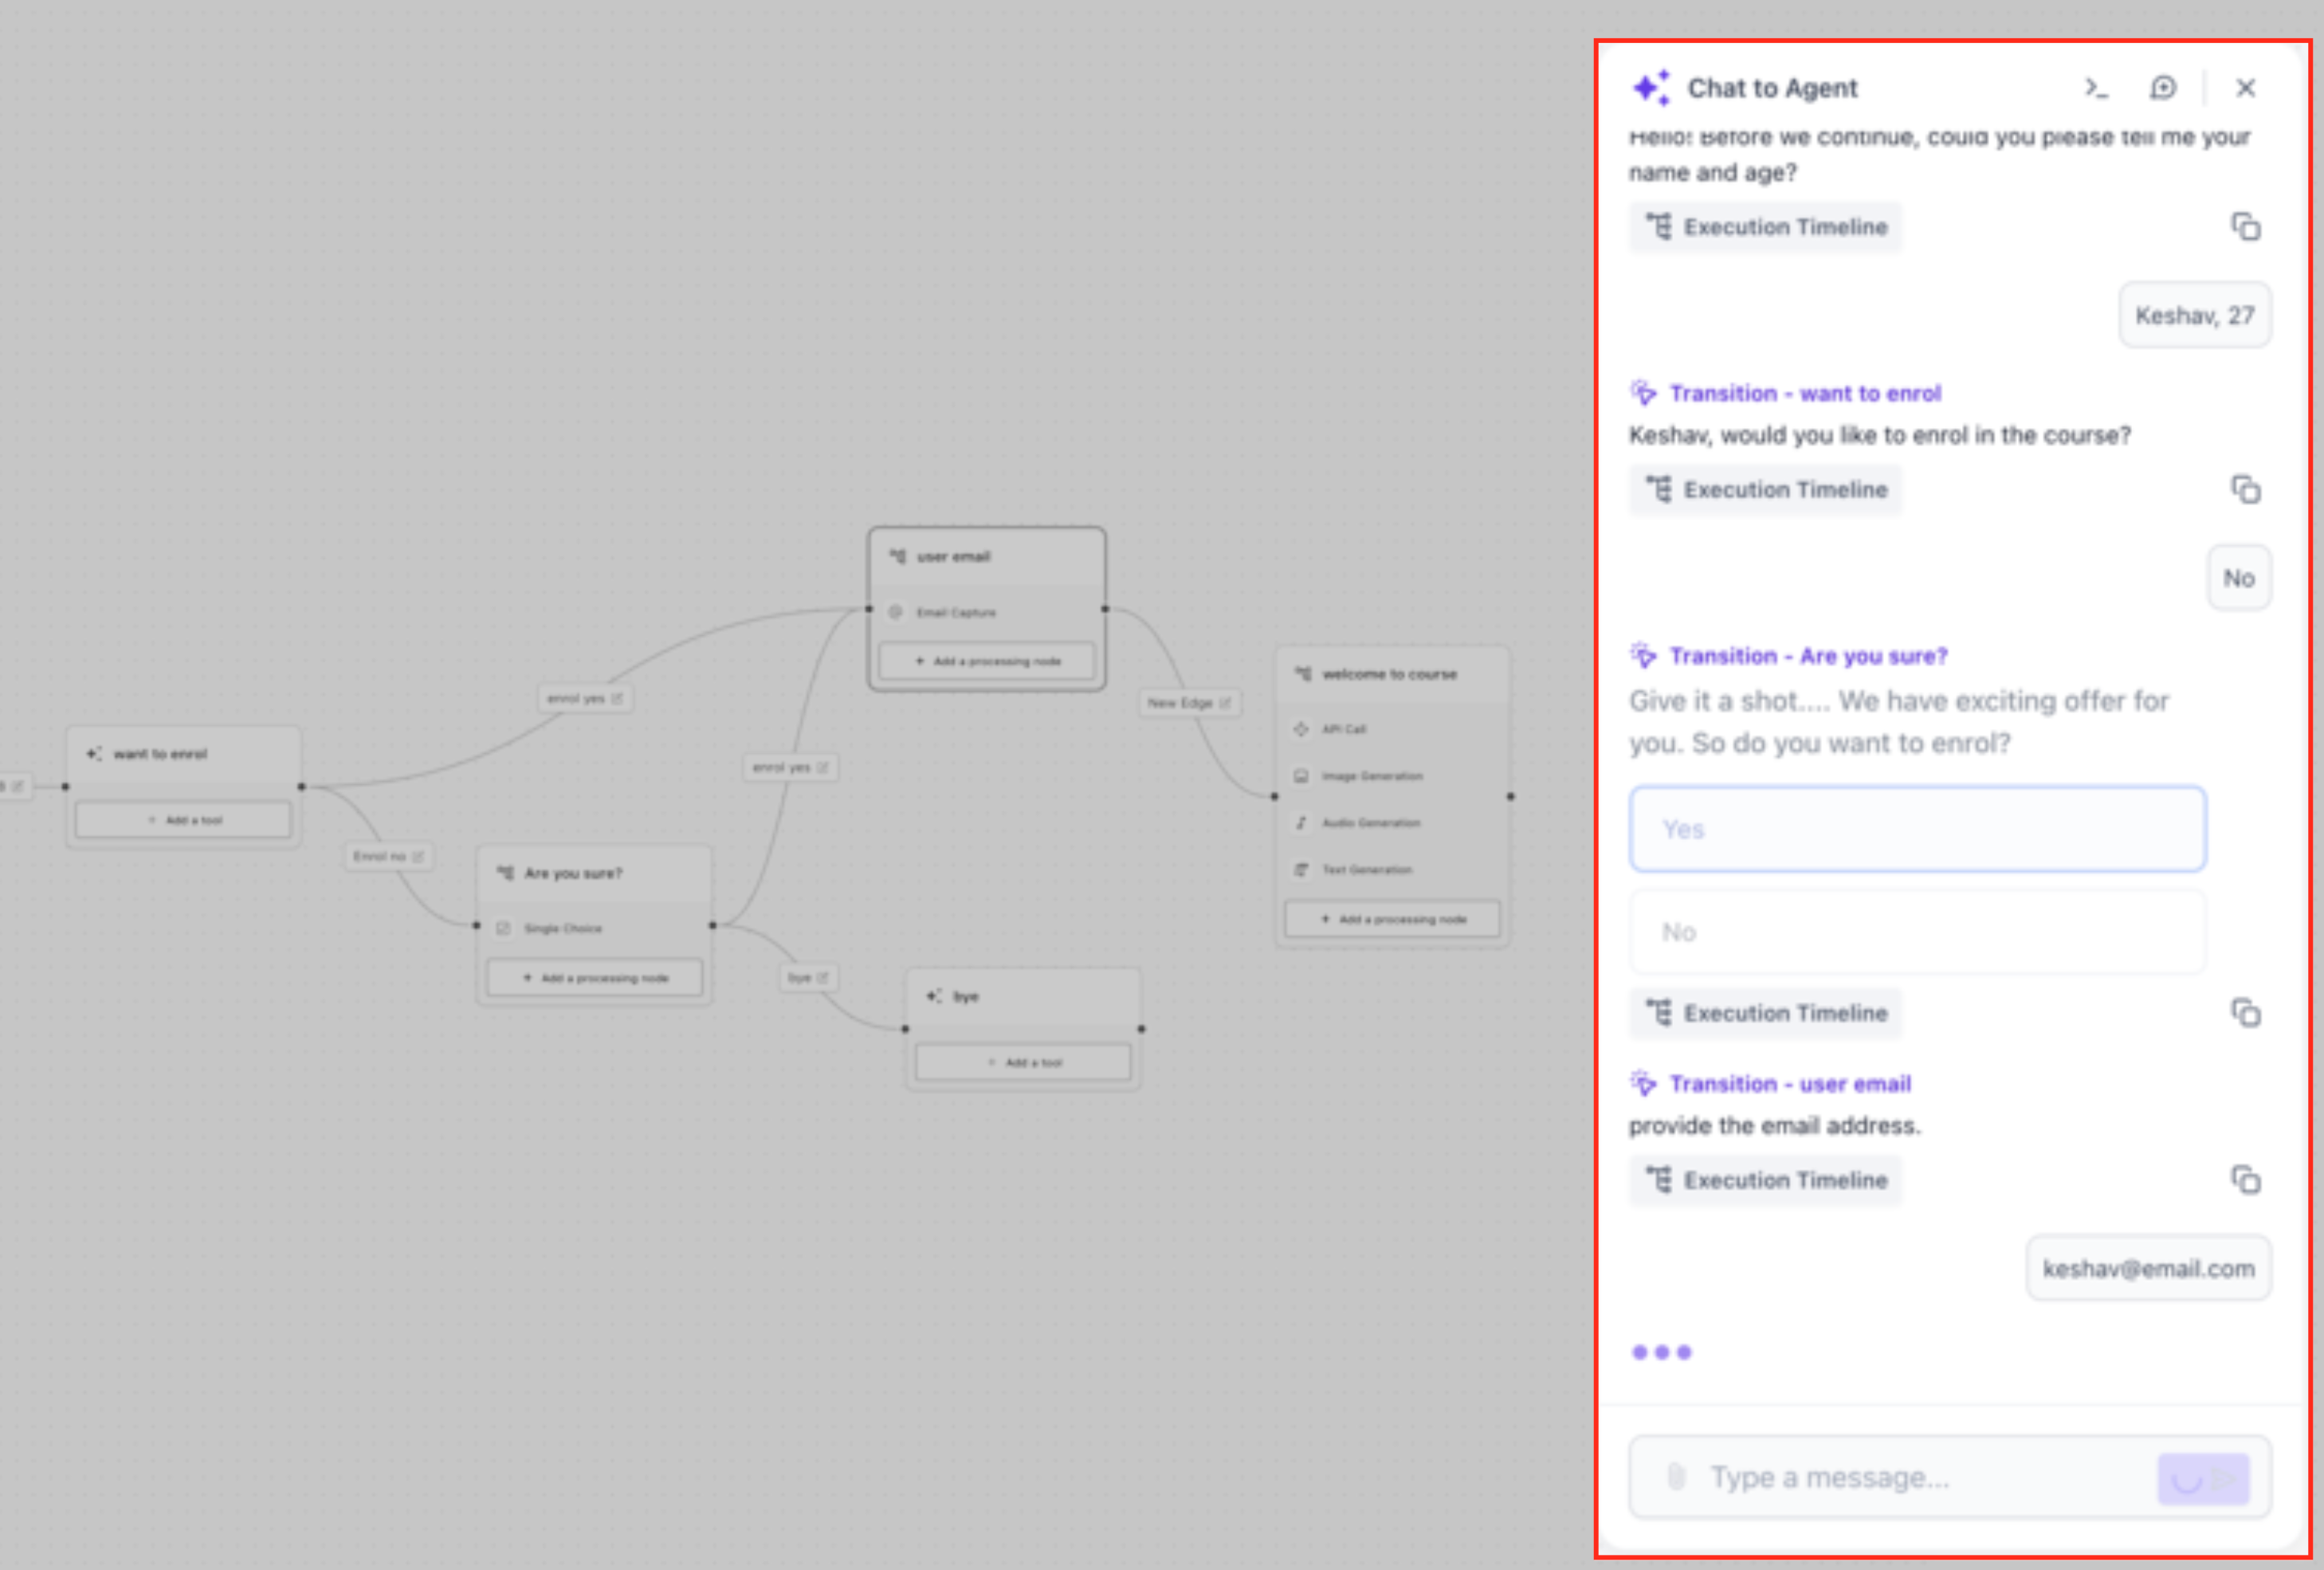
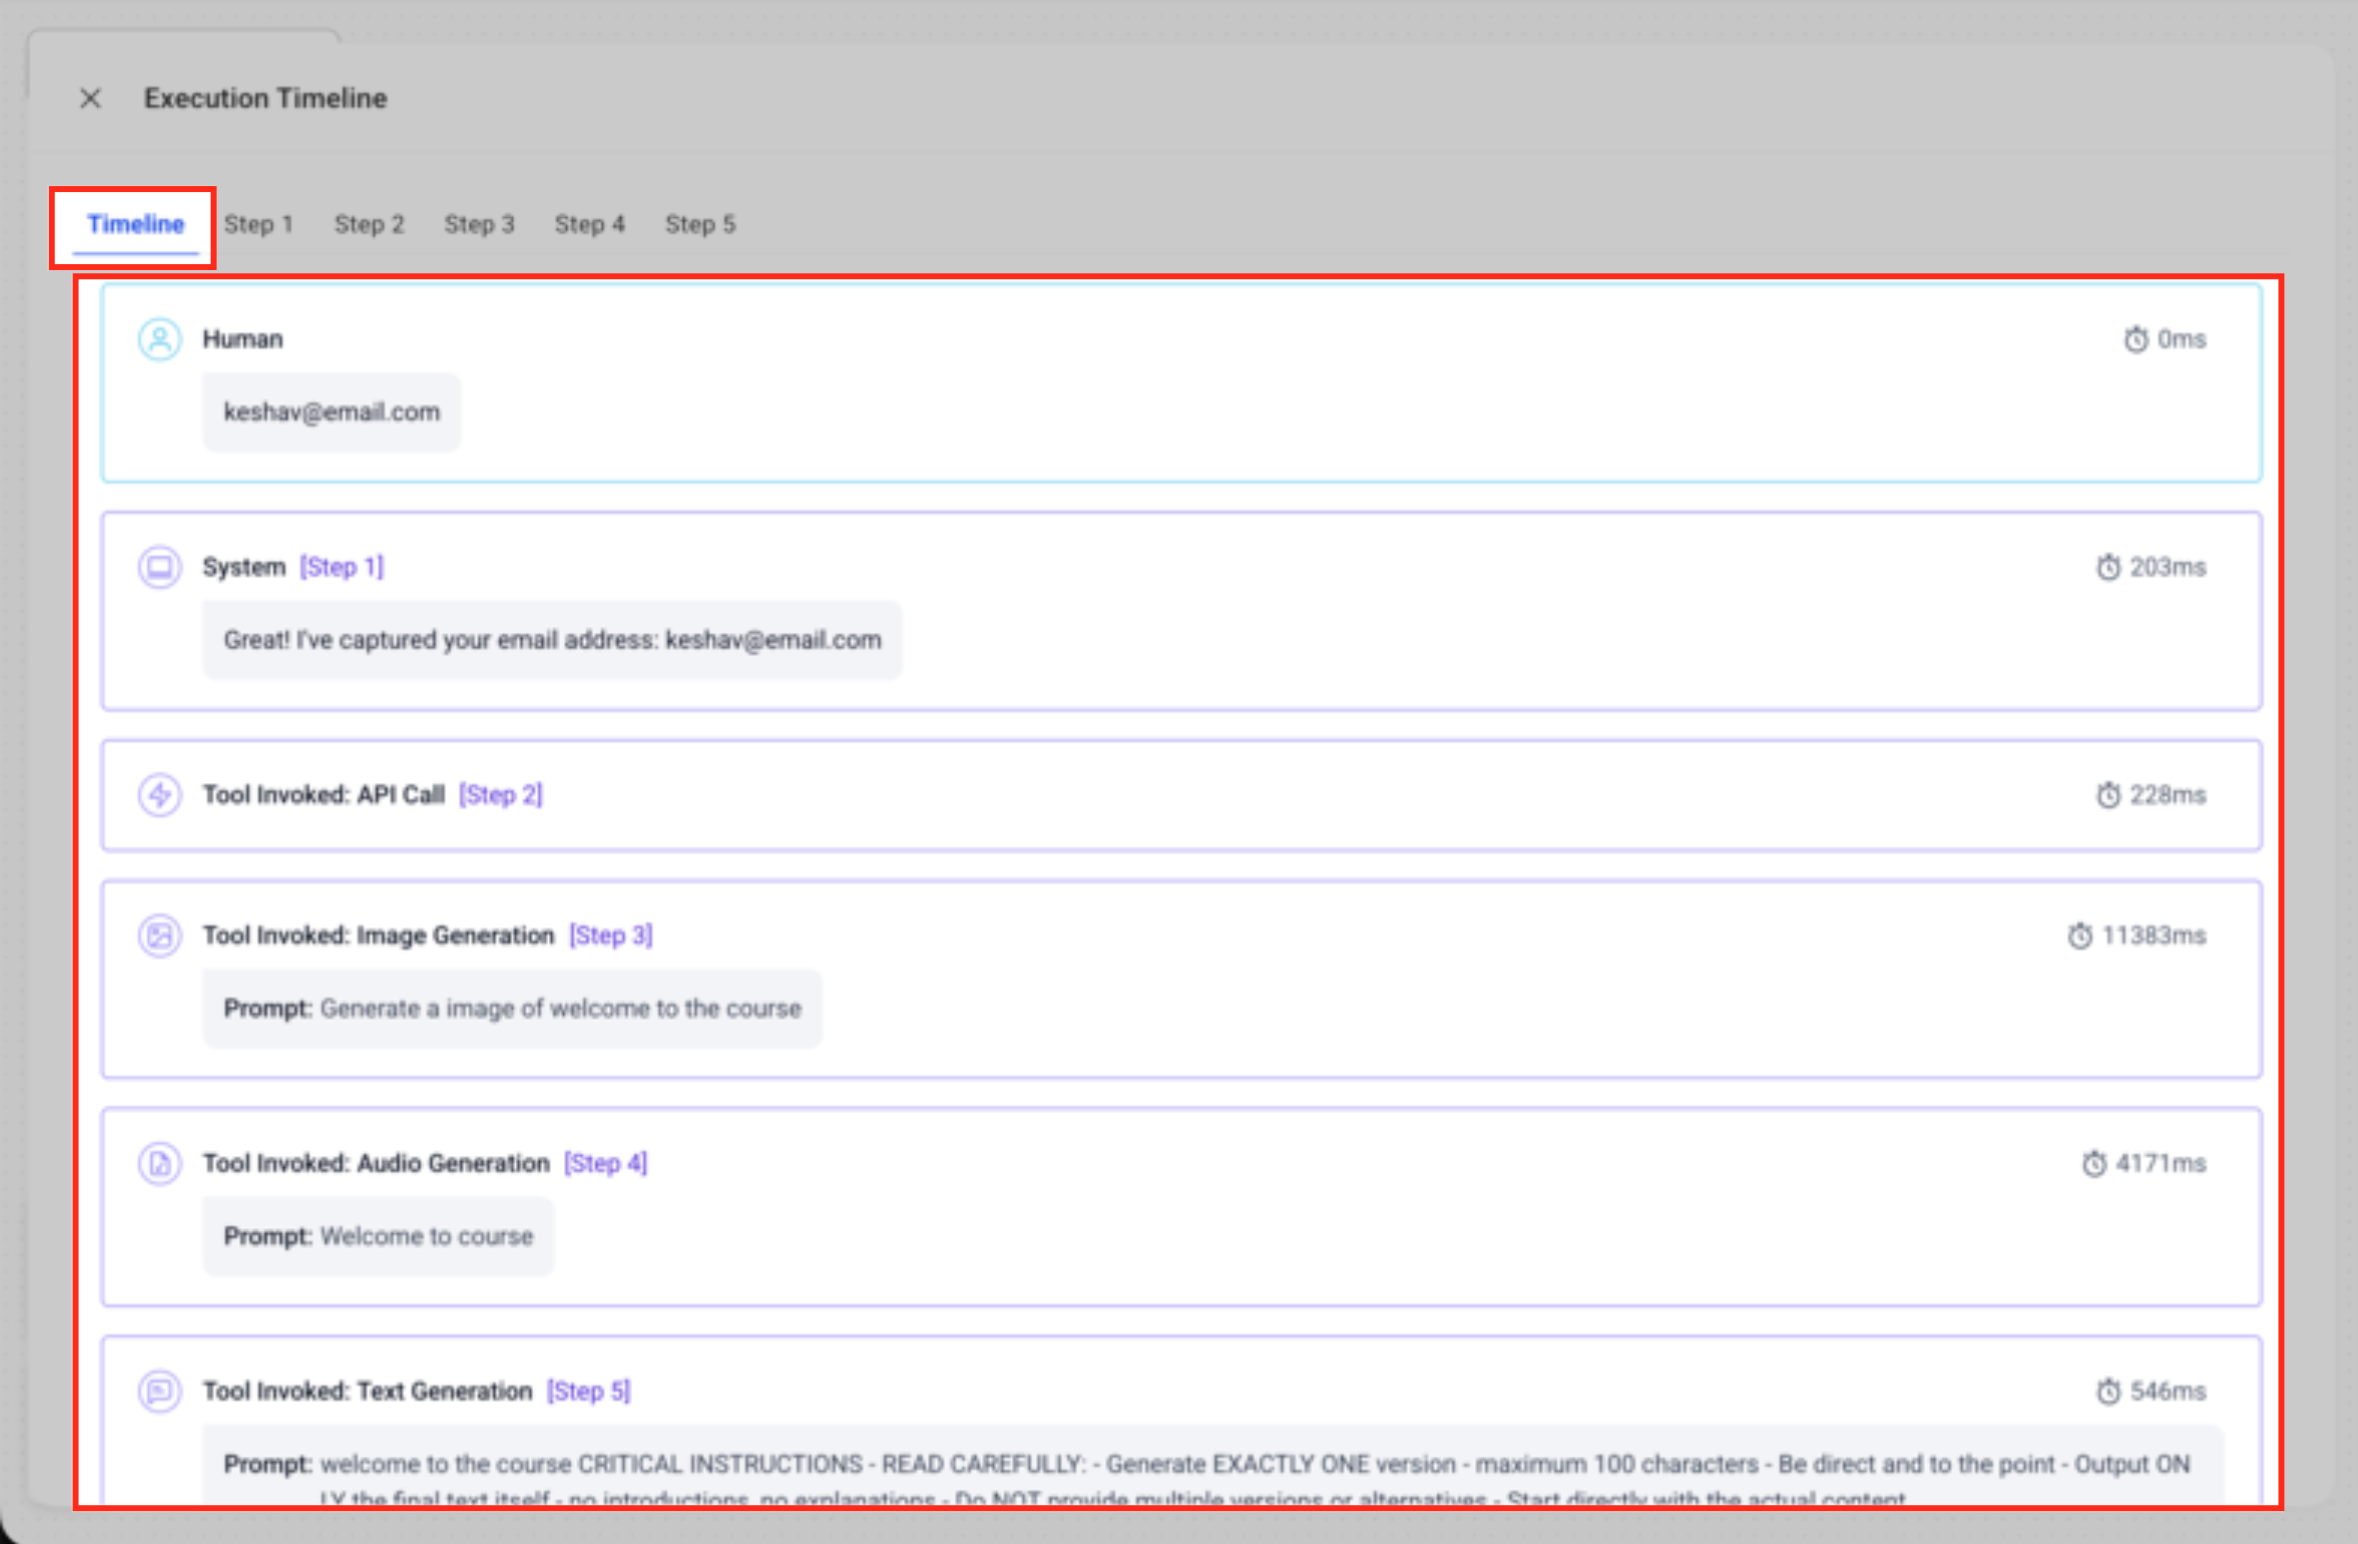
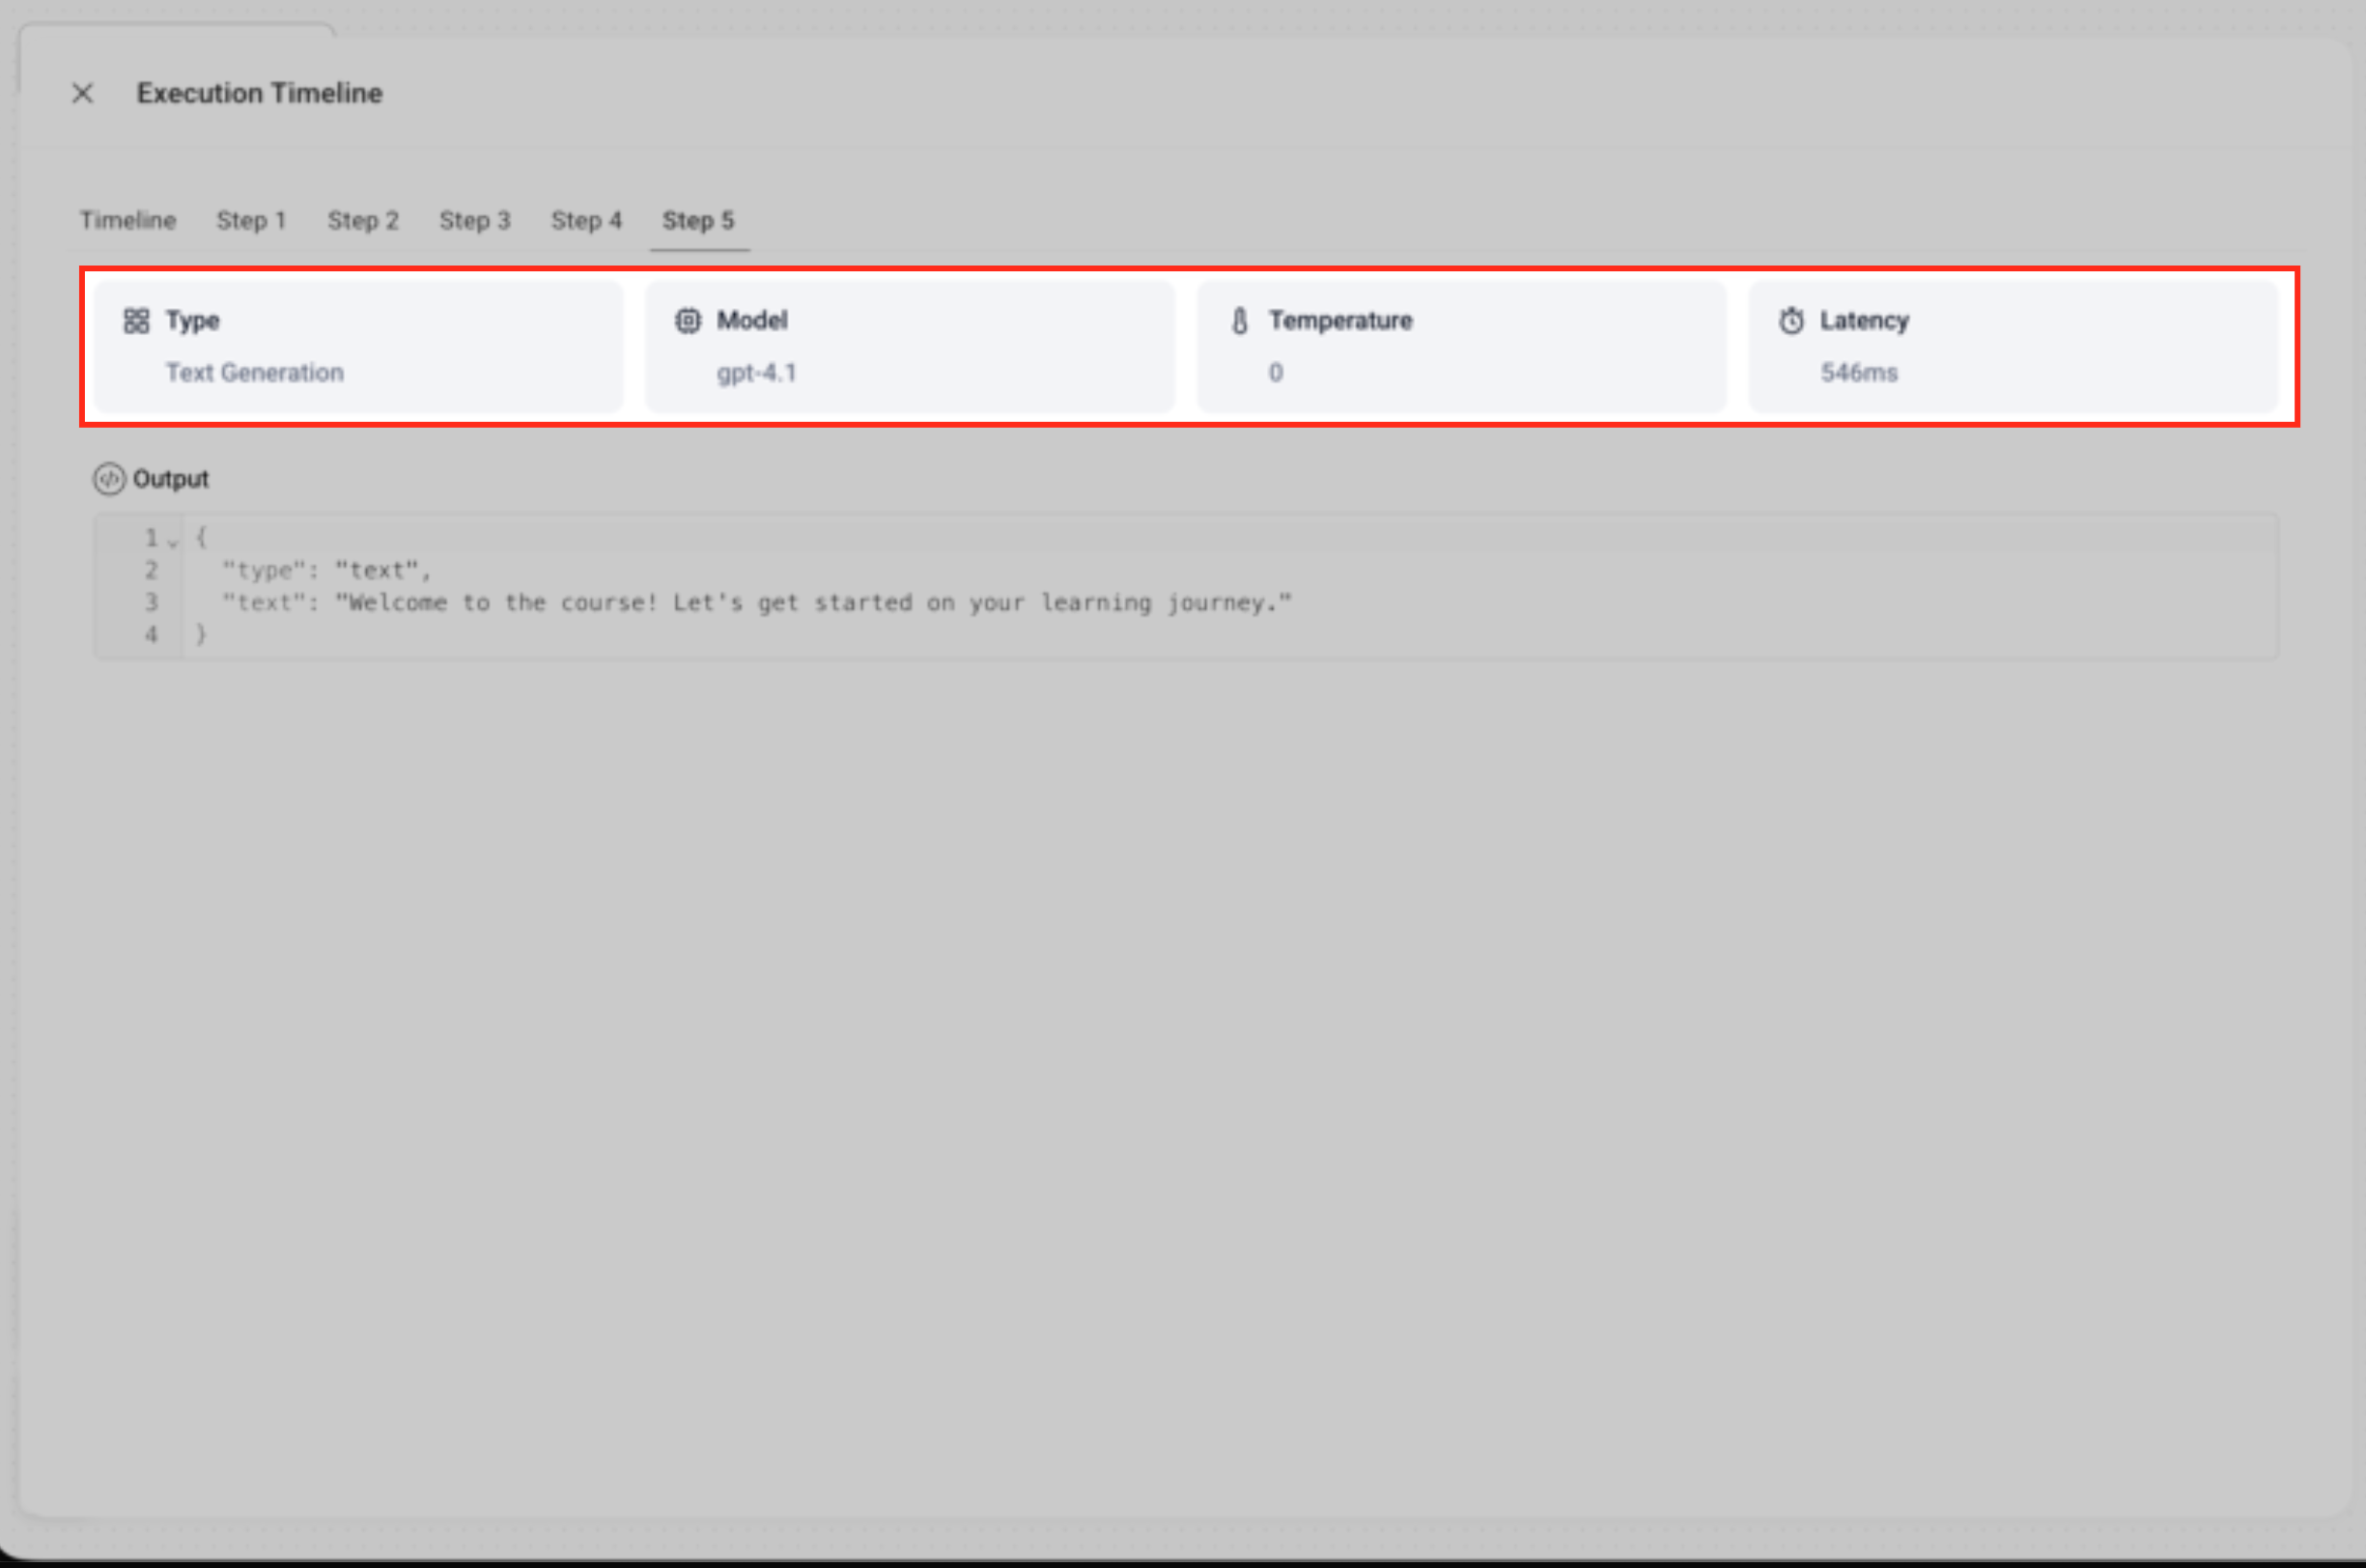
- Side-by-side layout with the Timeline for simultaneous review * * * ## How to Test and Debug AI Conversations in Agent Studio This section walks you through how to use the Timeline and Chat Emulator together to inspect execution steps, identify issues, and optimize performance before publishing your agent. ### Open the Test Environment Navigate to AI Agents → Agent Studio and open the agent you want to test. Click the Test tab in the top-right corner to access the Chat Emulator and execution view. Missing Required Fields warning When the Test panel opens, Agent Studio scans your agent for missing required fields. If any required fields are missing, an orange warning appears at the top of the screen and lists the exact node and field you need to complete. The warning does not block testing, but completing the missing fields helps prevent confusing runtime errors.!(https://assets.patientcopilot.ai/eb2c2b990fa4815a.png) ### Start a Test Session Click Start to launch the Chat Emulator. The Message Execution Timeline will appear alongside the chat window automatically. Send a test message in the emulator or trigger the agent via API. As the agent processes the request, each node transition, tool call, and model execution step logs in real time in the Timeline panel.!(https://assets.patientcopilot.ai/3f51b557ae4e29c4.png) ### Review Execution Logs Examine the event cards in the Timeline to understand how the agent handled the conversation. Look for node names, tool activity, token usage, execution time, and any latency badges that indicate slower steps.!(https://assets.patientcopilot.ai/e59e0252cb16685d.png) ### Inspect Performance Metrics Click into individual log entries to review detailed metrics such as model version, input/output tokens, temperature, and cost estimates (if enabled). Use this information to evaluate efficiency and fine-tune prompts or tool configurations.!(https://assets.patientcopilot.ai/22f5429181432c1c.png) ### Jump to the Source Node Click the log card to automatically highlight the corresponding node in the builder. This allows you to quickly adjust logic, prompts, or variables without manually searching the canvas.!(https://assets.patientcopilot.ai/e64b9a3d660bd02e.png) ### Reset and Retest Use the Reset button in the Chat Emulator to clear the conversation and execution logs. Run the conversation again to verify that your updates resolved the issue.!(https://assets.patientcopilot.ai/00bb243f0473e128.png) ### Publish with Confidence Once testing confirms the conversation behaves as expected and performance is optimized, move your agent to Staging or Production as usual. * * * ## Frequently Asked Questions Q: Is the Timeline available for Voice AI agents? Yes. When you open the Test tab for a Voice AI agent, the same log view appears after a test call finishes. Q: Does the Timeline increase token usage or cost? No. The Timeline records metadata already returned by the model and tool nodes. Q: Can I export Timeline logs? Click the download icon in the upper-right of the Timeline to save a JSON file of the full execution. Q: Why don’t I see the Go to Node button? The button appears only after the agent has been saved at least once. Ensure you are not viewing an unsaved Draft. Q: Will resetting the Chat Emulator clear the Timeline? Yes. Reset clears both the chat context and its associated execution logs for a fresh session. Q: Is this feature gated by any plan? The Timeline and Chat Emulator are included with Unlimited AI Employee, the same plan required for Agent Studio. Q: Why do I see a “Missing Required Fields” warning when I click Test? Agent Studio detected one or more nodes with required fields that are not filled in. Open the listed node, complete the required fields, and save to clear the warning icon and avoid configuration errors during testing. * * * ## Related Articles - How to Use the AI Agent Studio in Patient Copilot
- Ask AI + Agent Studio Integration
- Intent-Based Routing in Agent Studio (AI Router Node)